Linked Data for Digital Humanities
 Linked Data for Digital Humanities provides insights into how digital technologies can enrich and diversify humanities scholarship and make it pioneering in the digital age.
Written in non-specialist language, the book illustrates how information is captured, published, represented, accessed, and interpreted using computational systems and, in doing so, shows how technologies actively shape the way we understand what we encounter. Focusing as it does on underlying Web architecture and projects accessible online, the book has an inherently international focus. The interdisciplinary case study examples include bibliographic data from works published in England between 1470 and 1700; literature from ancient Iraq; jazz performances, predominantly from the USA in the 1930s; and even reach as far as an alien, fictional future. Whilst these case study examples span vast spatio-temporal distances, they all share a common thread in the use of the Linked Data information publication paradigm. Using existing computer science methods, as well as processes such as ontology development and database design, the book also includes reflections on practical considerations and offers advice about how to take institutional policies, socio-cultural sensitivities, and economic models into consideration when implementing Linked Data projects.
Linked Data for Digital Humanities discusses technological issues in the context of Humanities scholarship, bridging disciplines and enabling informed conversations across disciplinary boundaries. It will be of interest to humanities scholars, computer and data scientists, and library and information scientists.
zum Buch im ULB-KatalogPlus
zum Buch auf der Verlags-Website
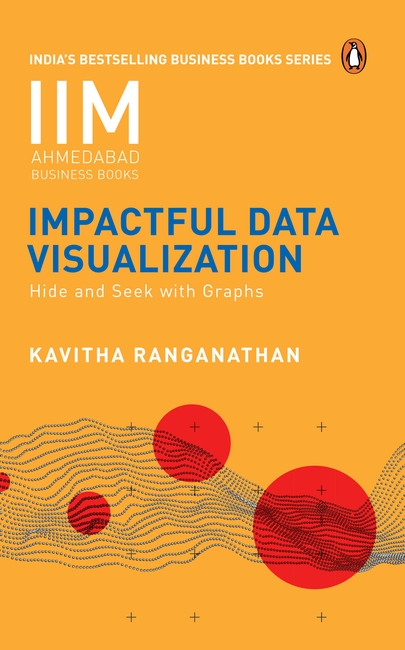
Impactful data visualization: hide and seek with graphs
 Water, water, everywhere, nor any drop to drink,
Data, data, everywhere, no time to stop and think!
There is scarcely a role that does not require us to understand, analyse and present data. Charts, graphs and maps are everywhere. However, many of these data visuals leave the viewer bewildered, confused or (even worse) with an incorrect understanding of the data. In contrast, if designed well, data visualizations help us make sense of data and communicate our insights better.
Bringing her clear classroom-teaching style, which has helped hundreds of data wranglers, to this book, the author walks you through the myriad ways that graphs can mislead, helping to spot visualization traps and prevent misinterpretations. She illustrates core design principles for creating truthful and effective data visualizations, assisting you to master the art and science behind creating impactful and accurate graphs. Packed with examples to clearly explain the dos and don’ts of data visualization and backed by empirical research, this book will transform the way you create and analyse graphs and charts.
zum Buch im ULB-KatalogPlus
zum Buch auf der Verlags-Website
